

Understanding Today's Economy and Financial Markets
The Economic and Market Update newsletter features regular commentary on economic trends, financial markets, inflation, interest rates, and business conditions from Steve Gattuso, Director of the Golden Griffin Fund and assistant professor of economics and finance at Canisius University. With more than 30 years of investment industry experience and CFA, CFP, and CMA credentials, he provides timely analysis of the issues shaping the economy and investment landscape.
September 30, 2026 - Crude Awakening
Latest Developments and Economics
In mid-September, the Federal Open Market Committee followed through on its August Jackson Hole guidance by raising interest rates 0.25% - the first hike in three years. The committee approved the move by a 12–0 vote—only its second unanimous decision since June 2025—putting an exclamation point on the policy shift. Although the increase displeased the President, who believes rates should be below 1.0%, it reinforced the Federal Reserve’s independence and credibility and marked its first step toward addressing persistently above-target inflation. The commentary included suggestions of further hikes to come and no cuts until 2027. The decision reset market expectations for additional rate increases, with the highest estimated probabilities in December (78%) and March 2027 (69%).
 |
Markets have already supported the Fed’s tightening efforts, as Treasury yields have risen across maturities. In anticipation of higher rates, the two-year Treasury yield increased 0.52 percentage points in one month, from 4.35% to 4.87%, while the ten-year yield rose 0.54 percentage points, from 4.75% to 5.29%. Both were unusually large moves over such a short period.
So, what is influencing the Federal Reserve’s decision and why are fixed income markets reacting so emphatically? There are a few reasons behind the recent activity. First, inflation is expected to continue at higher than target rates for the near future. Much of this is driven by the energy situation and the conflict with Iran. Despite flows improving through the Strait of Hormuz to at least 80% of pre-war, that has been due to extraordinary mitigation to avoid continued attacks on freighters. Some of these techniques include: U.S. Navy escorts and nighttime passage, using alternate transport methods (Red Sea and overland pipelines) and offshore ship-to-ship transfers. Although the price of brent oil has generally traded in a range of $90-$110 recently the price of refined products has soared due to the cost of these extraordinary measures. According to shipping brokers the average cost to rent a tanker moving through the Strait in 2022 was about $16,000/day and that is now approximately $1,000,000/day. This, together with the additional insurance, means that the cost of shipping oil jumped from about $7/barrel to about $30 per barrel according to Poten & Partners shipping brokerage. In addition, the Russia-Ukraine war and attacks in the Middle East is taking refining capacity out of the global system. This explains why the price of refined products (gasoline, diesel, etc.) have risen much higher than the commodity.
It is the price of these end products that have most potential to cascade through the economy and keep inflation elevated. After falling to $3.92/gallon in August, gasoline prices have averaged $4.34 by the end of September. Diesel, which is more crucial for commerce and transportation, have risen from an average $5.60 at the end of August to $6.53 by the end of September (with California up to $8.00). This is up dramatically from the $3.75/gallon of diesel at the end of 2025. Diesel costs propagate through the price of inputs for farmers to groceries to retail store shelves as well as construction and public services (i.e.: city buses). Assuming 100,000 miles per year for long-haul trucks that adds about $43,000 more for fuel than last year. Finally, tariffs are still part of the inflation picture as well.
Headline CPI rose 0.4% in August and 3.4% over the year, broadly in line with expectations. Core CPI increased 0.3% for the month and 2.4% year over year. Both monthly readings were higher than in July. The Fed’s preferred inflation gauge, PCE, rose 3.4% overall and 3.0% excluding food and energy. Although both PCE readings were below expectations, they remain too high for the Federal Reserve, with risks tilted to the upside given that it doesn’t incorporate the recent rise in diesel.
 |
The second issue affecting bond yields is the current fiscal situation and budget deficits. Persistent deficits of $2 trillion annually in a time of positive economic growth means that the U.S. Treasury needs to issue significant new debt to roll maturing debt and fund the $40 trillion in accumulated debt. Interest costs exceeding $1 trillion annually are taking a bigger share of the annual budget (around 14%) and investors are demanding a term premium to hold longer-dated maturities as compensation for uncertainty surrounding long term inflation.
A third related component affecting yields is the significant amount of debt being floated by central banks globally and hyperscaler companies for AI build out. According to Vanguard the global issuance of corporate debt related to AI build out will reach a projected $570-$600 billion. A bit of crowding out may be starting that is causing yields to rise and credit spreads to begin to widen. Investment grade corporate bond spreads moved just a little from low-80s to about 84 bps on the Bloomberg Corporate Bond Index. High-yield, however, moved more. The BB OAS spread from treasuries moved from 1.52 to 1.94 bps in September and CCC OAS jumped from 10.42bps to 11.79 bps.
The final factor behind rising rates is a positive one: the economy remains strong. Real GDP grew 2.2% in the second quarter of 2026, following 2.5% growth in the first quarter. Business investment tied to the AI buildout has been a key driver, with capital expenditures projected to reach $800 billion in 2026. Consumer spending also remains resilient, with household spending up 6.1% through August. U.S. manufacturing activity also expanded for the ninth consecutive month in September.
New orders rose as well as backlogs increased.
Together, these factors and expectations for further Fed tightening have driven yields sharply higher. Among them, Federal Reserve rate increases are likely to have the greatest effect on the last one - economic growth. The rest of the factors are either supply shocks or out of Federal Reserve scope.

A weakening labor market could shift the Federal Reserve’s focus away from inflation and further rate increases. For now, broad indicators suggest the labor market remains balanced. Nonfarm payrolls rose by a strong 162,000 jobs in August, while the unemployment rate held steady at 4.1%. Leisure and hospitality added 62,000 jobs, and government and education added 35,000. Construction gained 22,000 jobs—solid growth, but not excessive given the pace of data center development.
Information technology employment fell by 23,000 as the sector remains at the forefront of AI adoption. Payroll data are subject to significant revisions, however. The chart below further illustrates labor market balance, with job openings declining to roughly the number of unemployed workers.
 |
One other topic to cover is the rapidly approaching midterm elections. While this can cause anxiety with investors, historically, elections are not drivers of market returns. While midterm election years can cause more volatility, the year after elections are generally good. According to Fidelity, 95% of the time the S&P 500 posted gains in the 12 months following midterm elections. Economic conditions and corporate earnings are much more important drivers of equity returns than politics. With that in mind it is worth a look to see what scenarios may develop. In the Senate 35 seats are up for election out of 100 and Republicans currently hold 53. In the House all 435 seats are up for election with Republicans holding 219 and Democrats holding 214. Given that both parties have held slim majorities recently the chambers are quick to flip. Current Kalshi odds favor Democrats winning at least the House and more obtaining a majority in both chambers. Once again, the majority would
most likely be slim creating divided government. A divided government does have the characteristic of less sweeping policy changes making the regulatory and economic environment a bit more stable.

Financial Markets
Another awakening this year, though not as rude, was the flip in the S&P 500 returns. At the end of the first quarter, the index was down 4.3%, led by a 9.1% decline in Information Technology. Since then, the sector has rebounded sharply and is now supporting the index. Although Energy is the year’s top-performing sector, its index weight is small. Information Technology and Communication Services were among only four sectors to gain during the quarter, alongside Health Care and Energy. As a result, the index rose even though the broader market had a more difficult third quarter. The rebound in Information Technology and Communication Services was large enough for the market-cap-weighted S&P 500 to overtake the equal-weighted index, which had led for most of the year. The rotation toward value has lost momentum as growth stocks have resurged.
 |
Strong corporate earnings and rising earnings expectations outweighed higher bond yields. Economic resilience, expanding margins, and robust profitability have reassured equity investors despite geopolitical and economic uncertainty and elevated valuations. Fixed-income investors, however, resemble the proverbial cat on a hot tin roof because of the factors outlined above. MidCap and Small Cap stocks also had a rough quarter due to the higher interest rates though remain positive for 2026. International equities were flat for the quarter and developed markets still are ahead of the S&P 500.
 |
The rapid 10% rise in yields has weighed heavily on fixed-income returns this year, particularly for longer-duration securities. The U.S. Aggregate fell 3.5% for the quarter, while long-dated Treasuries declined nearly 9%. On the positive side, investors can now earn close to 5% on Treasury notes maturing in three to five years. This represents a positive real yield even if inflation remains near 2.5%. The 10-year Treasury’s 2.9% real return is the highest inflation-adjusted return in 18 years.
However, higher yields create a greater near-term headwind for equities. The 10-year Treasury yield now exceeds the S&P 500 earnings yield without carrying equity risk.
The information contained herein should not be construed as personalized investment advice or a solicitation to buy or sell any security.
Investing in the stock market involves risk of loss, including loss of principal invested and may not be suitable for all investors. Past performance is no guarantee of future results. This material contains certain forward-looking statements which indicate future possibilities. Actual results may vary. All expressions of opinion reflect the judgement of the authors as of the date of publications and
are subject to change without prior notice. Additionally, this material contains information derived from third party sources. Although we believe these sources to be reliable, we make no presentation as to the accuracy of any information prepared by an unaffiliated third party.
August 31, 2026 - Pardon the Interruption
Latest Developments and Economics
Recently, the federal government has taken a more active role in several market segments, including equity investments in certain U.S. companies and involvement in merger transactions. This month has continued with more of this type of activity. The first was an interruption of market forces affecting the currency exchange rate between the U.S. dollar and the Japanese Yen. As the Yen approached 160 per U.S. dollar (up from 100 in 2017) the Japanese government intervened by spending $96.5 billion in the last month to buy the Yen and support its price versus the U.S. dollar.
Japan taking this action to support its currency is not unusual. It has been done since 1998 and most recently in 2024 but, the fact that the U.S. also lent Japan money to purchase Yen to help support it was different. The Treasury sold Euros to lend and, although did not publish the amount, it was estimated to be in the $5-10 billion range – small relative to Japan. The size wasn’t as important as the signal. Treasury Secretary Bessent remarked that a “disorderly Yen” would most likely cause the Japanese government to sell the treasuries which would put upward pressure on U.S interest rates. Japan, as the largest foreign buyer of U.S. treasuries, has an outsized impact on U.S. rates. At issue is how long this support lasts without market forces that become more balanced to support the Yen.

 Long-term interest rates in the U.S. have been steadily rising from a low yield of 3.97% in March towards 4.70% and has caused Bessent to interrupt market forces again with a ‘twist’ meant to lower the yields on long-term treasuries. The August announcement that the Treasury would double the size of long-term treasury purchases from $2 billion to $4 billion through November caught markets off guard. The Treasury did not say how they funded the purchase but, if it were funded by issuing more short-term debt that would be akin to paying down a mortgage with a credit card. Yields rebounded higher just a couple of days after the announcement, so the impact was temporary. Generally, even doubling purchases is just a rounding error compared to the size of the treasury market. A further announcement that the Treasury General Account (TGA) could be used for bond purchases would be a much bigger swing. There is almost $1 trillion in what is considered the government’s ‘checking account’ but, then they risk using funds that could be needed in a rainy-day situation (like a debt ceiling issue which could come up again in early 2027).
As of the end of the month the 10-year yield ended near 4.76% - a short hop away from the psychological 5.00% which could pose a headwind for equities and the economy. We have never had such a high yield while our national debt levels have been so large. Federal debt crossed $40 trillion this month and the interest cost on that level has run over $1 trillion in the last year. Debt service is now the third largest expense in the federal budget and is at least 15% of the entire budget. Debt is now about 120% of Gross Domestic Product (GDP). Both are at levels that are not sustainable in the long term. Bessent is trying to manage the price of money to keep the interest cost down as much as possible as he has no authority over the debt levels. This attempt drew criticism in the financial industry as a transparent artificial interest rate management, masking deeper financial issues.

The increase in interest rates is not just a U.S. phenomenon but, is global in nature. This is driven by inflation expectations exacerbated by geopolitical events, rising energy prices across the world and debt issuance. Inflation is being impacted by a recalibration of trade policy and deglobalization. In addition to sticky inflation there is massive amount of new debt across the globe by governments funding deficit spending and by corporations raising capital for the buildout of artificial intelligence.

 In the same week as Bessent’s bond actions, Fed Chairman Warsh made his comments after the annual Federal Reserve Jackson Hole retreat in which he struck a hawkish tone again. In the speech he made clear that inflation was the FOMC’s primary focus and that the 2.0% figure was the uncompromising target. He also indicated that Personal Consumption Expenditures (PCE) was the primary inflation measure they were using and, if inflation does not meaningfully move towards that target, the FOMC has “work to do”. He also reiterated that the Federal Reserve will be “quieter” in terms of forward guidance and that short-term interest rates are the main tool they will use to accomplish the task. In essence, this almost backs him into a corner of a rate hike in September when the FOMC meets again. Markets’ expectations increased to a 60% chance of a rate hike. This puts the FOMC in direct opposition to what Treasury Secretary Bessent is trying to do. So Bessent is actively trying to lower long rates while Federal Reserve Chairman Warsh is laying groundwork for short-term rate increases. This economic tug-of-war will play out for the rest of this year.
In just over two weeks we will see a test of this direction when the FOMC meets again. The Jackson Hole speech by Kevin Warsh made a strong case for a rate increase and Warsh himself said that being accountable to a 2.0% inflation target was “the only true test of our credibility”. Warsh and the FOMC will be in a tough spot. If they raise rates, as prepped, then Warsh will have aided the perception of Federal Reserve independence from political pressure however, it will also be opposed to Bessent’s actions and is likely to draw the ire of President Trump who installed him in office to lower rates. If rates stay where they are then the credibility stated above is at risk and could generate more interest rate volatility. Kevin Warsh could be justified in leaving rates where they are if new economic data support a weakening economy (through jobs/consumer) and/or disinflation progress.
 The July jobs report was surprisingly weak. The nation just added a net 23,000 jobs, where 83,000 were estimated, the second worst report this year. There was a 40,000-job contraction in leisure/hospitality, which may have been impacted by the end of World Cup. There was also a downward revision of 103,000 jobs for the previous two months (June -37,000 and May -66,000 in May). The unemployment rate ticked down to 4.1%, mainly due to approximately 264,000 people leaving the workforce. This leaves the participation rate at 61.4% of working age population, lowest since 2021. Also, wage growth continues to slow and, at 3.2%, is below recent inflation figures.
 The consumer may not be happy (as defined by consumer confidence) however, they do continue to spend. Retail sales did drop 0.6% in July but are still up about 5.0% from July of 2025. Inflation accounts for some of this spending as people spend more to maintain the same level of goods.
 The Fed’s preferred measure of inflation, the PCE, is proving more stubborn than CPI. Headline PCE increased 0.2% for the month and 3.7% over the last year. Core PCE (excluding food and energy) is up 3.3% over the last year. The headline Consumer Price Index (CPI) was up only 0.1% for the month and 3.4% for the year. Core CPI was up 2.6% from a year earlier. The difference can be accounted for by the large increase in capital spending related to artificial intelligence and the sharp decline in housing and how each are weighted between the two measures. Recently, energy price rebound due to lack of progress with Iran and additional tariff measures, especially with Canada, will put upward pressure on prices in the near term.
Financial Markets
Equity and fixed income markets sent different signals in August. U.S. large-cap equities recovered from a lackluster June and July, with the S&P 500 gaining 2.7% for the month. The index posted positive returns in April, May, and August, while the other months this year were flat to down. Sector performance was mixed. Energy led with a 7.0% monthly return, driven by oil prices responding to ongoing conflict in the Middle East and limited oil flows through the Strait of Hormuz. However, because Energy has a relatively small weight in the index, its overall impact was modest. Information Technology again made the largest contribution, rising 6.25% for the month and accounting for most of the index’s return. Materials, Health Care, and Financials also posted gains, while the remaining sectors declined. Technology benefited from companies tied to artificial intelligence spending, including Nvidia, which reported strong earnings. Projected AI-related spending helps explain the sector’s recent strength. U.S. companies also had a strong quarter, with earnings up nearly 50%, though some of that increase reflected unusual items. For example, Alphabet (Google) and Amazon reported pre-tax unrealized investment gains totaling about $151 billion, which distorted reported earnings. Even after adjusting for that impact, S&P 500 second-quarter earnings were still up about 32%. Tariff refunds to companies of $100 billion have also been an earnings tailwind. Earnings growth estimates for the index were also revised higher, largely on optimism tied to AI, creating added concentration risk. Nvidia and Micron alone account for roughly 30% of expected earnings growth going forward. This technology concentration also helps explain why the NASDAQ 100 outperformed the S&P 500 in August, rising 4.2%. The Magnificent 7, despite varied individual performance, gained 4.4% for the month. In the U.S., mid-cap and small-cap stocks were essentially flat. International equities outperformed the S&P 500, with the S&P Developed Ex-U.S. up 3.3% and the S&P Emerging BMI up 3.93%, also reflecting some AI-related influence.


Fixed income markets continued to face upward pressure on U.S. yields, driven by expectations for rate increases, persistent inflation, geopolitical uncertainty, heavy issuance tied to AI funding, and concerns about sovereign budget outlooks. The 10-year Treasury yield rose to 4.75% from 4.60%, while the 30-year yield moved above 5.0% for the first time since 2007. This is where equity and fixed income markets diverged in their assessment of the environment. Despite 5% Treasury yields, $90 oil, and inflation above 3%, equity-implied volatility remained low and continued to fall, with the VIX near 15. In contrast, the bond market’s equivalent volatility measure, the MOVE Index, moved higher. Equities are signaling calm, while fixed income markets are pointing to elevated risk.

The information contained herein should not be construed as personalized investment advice or a solicitation to buy or sell any security. Investing in the stock market involves risk of loss, including loss of principal invested and may not be suitable for all investors. Past performance is no guarantee of future results. This material contains certain forward-looking statements which indicate future possibilities. Actual results may vary. All expressions of opinion reflect the judgement of the authors as of the date of publications and are subject to change without prior notice. Additionally, this material contains information derived from third party sources. Although we believe these sources to be reliable, we make no presentation as to the accuracy of any information prepared by an unaffiliated third party.
July 31, 2026 - Hard Target
Latest Developments and Economics
Kevin Warsh’s second FOMC meeting and press conference should have basically been a nonevent given the results of the two-day meeting. There was only a one-word change from the June FOMC statement after the meeting and the committee kept interest rates right where they were between 3.50-3.75%. The only newsworthy item might have been that the vote was 9-3 to hold rates with governors Kashkari, Logan and Hammack dissenting in favor of a rate increase. Even this isn’t too unusual lately as dissenters have been on the rise in the last few meetings. It does signal more independent thinking by FOMC participants than the ‘one voice’ committee we have seen through the last few Federal Reserve chairs. However, after the normal press conference, interest rates increased significantly and steepened with the short maturity yields dropping and long maturity yields rising significantly. Chairman Warsh was very clear about the focus on bringing inflation down and set a hard target of precisely 2.0%. This commitment seemed not to align as well with his press conference Q&A where reporters seemed rather confused and even challenged why rates were not raised this meeting if the committee was so determined. Moreover, Warsh indicated his preferred direction of less guidance going forward and the possibilities of eliminating the press conference and even having the FOMC meet less often. This opacity has the potential of causing more volatile debt markets as the path and plan to 2.0% remains unclear. The Fed has many tools available to help achieve their goal, but each have different effects. Apollo Chief Economist Torsten Slok draws a good analogy by comparing it to someone telling you that they are going to take you from New York to Los Angeles but not telling how you will get there, the cost nor the length of time it will take. Kevin Warsh already had a controversial appointment given that President Trump specified he wasn’t going to appoint anyone who did not fulfill his desire for lower rates. The lack of guidance and delay in addressing inflation is soon going to affect credibility. The chairman had announced 5 task forces (communications, balance sheet, data sources, productivity and jobs, and inflation frameworks) on which he may be depending for future direction when they make recommendations later this year. However, he may not have the luxury of time if inflation does not show signs of moving lower by the September meeting. Markets have already built in about a 63% chance that interest rates will rise, and the committee, already leaning towards a rise, may feel pressured.

The energy price reaction to the continued war with Iran has resulted in an increase in long-dated rates across the globe but, none more than the U.S. This is due to expected inflation as well as continued large federal budget deficits and the significant amount of debt issuance, especially related to AI, all while market percipients have not maintained historical purchase activity.

The latest CPI reading from June might have provided some comfort that inflation was trending in the right direction Headline CPI fell 0.4% month-over-month in June – the first drop since April 2020. However, this was mainly due to the 5.7% drop in energy which was caused by an almost 10% decline in gas prices after the MOU was signed with Iran. Headline CPI for the last 12 months was still 3.5%. Excluding Food and Energy, Core SPI was flat for the month and sits at 2.6% over the last 12 months.

Peeling back the onion just a little reveals the Federal Reserve’s concern. The energy impact is a supply shock caused by the war with Iran. Historically, Federal Reserve rate increases have little effect on supply-driven inflation shocks as they work more against demand-driven inflation. The broadening of inflation beyond energy is what could be the issue that prevents inflation from reaching the Fed’s 2.0% goal. Services, ex-housing, is still sticky and, even with the June decline, is still at 3.17% over the last 12 months.

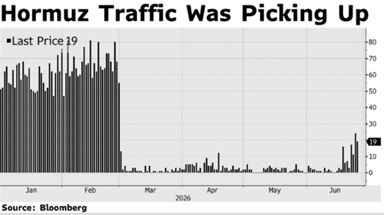
 During July military hard targets were in focus as the cease fire between the U.S. and Iran ended in all but name. The month also saw the potential for the conflict to broaden with Iranian ballistic missiles and drones striking military installations housing U.S. personnel in Jordan, Bahrain, Kuwait, Oman, and Qatar and Ukraine getting in the mix. The result is the Strait of Hormuz traffic falling back to pre-MOU levels and Iranian-backed Houthi’s attacking Saudi oil tankers moving through the Red Sea. This sent Brent oil over $100 in July before ending the month around $88 – it started July under $72. This increase will be reflected in July inflation data. If this continues longer the precarious situation with oil inventories (mentioned last month) could become critical.
Another potential inflation topic that came back to the front in July was tariffs. As a brief review, the reciprocal tariffs imposed by the Trump administration in April 2025 were deemed beyond the authority of the emergency powers act (IEEPA) by the Supreme Court on February 20, 2026 (and that tariffs collected needed to be refunded). The administration at once imposed section 122, which granted temporary tariffs for 150 days at 10% to all countries except what was exempt under USMCA. Those expired on July 24, 2026 and the administration transitioned to section 301, which allows tariffs of 10% or 12.5% on 60 countries (representing over 99% of imported goods) based on lack of bans or enforcement of forced labor in import production. This controversial basis still requires investigation and evidence and is likely to be challenged. Section 232 tariffs are still in place on specific goods (mainly raw materials) with steel, aluminum and copper as much as 50%. While still additional cost relative to pre-April 2025 the incremental price change is minimal and does not look to be a source of additional inflation (see chart) and, may be lower for some than pre-April 2025. 
What is allowing the Federal Reserve room to wait is a labor market that is still at an uneasy stabilization. While new layoffs are historically low, so is hiring. The June labor report showed only a net new job creation of 57,000, far below estimates and the prior two months were revised down by a total of 74,000 jobs. Long-term unemployed are still having difficulty finding new jobs. Despite this the unemployment rate ticked down to 4.2% from 4.3% due to a decline in the labor force. While this signals a more balanced labor market, the data below the surface bears watching. In addition, while wage growth remains muted and is not a source of inflation, employers are still dealing with increased costs in the form of benefits.


Financial Markets
The assessment of U.S. large cap equity performance in July would depend on which index you happen to be reviewing. Taking the S&P 500 into consideration July would almost look like a nonevent. The index started the month at 7,499 and end at 7,490 – rather ho hum. The index was flat for the month (0.06%) but looking at intramonth movements would be a bit more exciting – the index ranged from 7,316 to 7,575 – a range of about 3.5%. Basically, July was a volatile month. The month could be boiled down into two main items – the volatility and dispersion in technology stocks and the rotation into other sectors. In rather rare form the Information Technology sector was the worst performer for the month – down 3.43%. This was led by AI-related concerns manifesting itself as volatility and pullback in the semiconductor industry. This is after a 12-month performance over 100%.


The second item represents a broadening of the market performance beyond technology and AI theme. The S&P 500 Equal Weight beat the S&P 500 (1.01% vs -0.06%) for the second consecutive month. The Equal weight still is well ahead for 2026 (13.26% vs 10.14%) and is about the same for the last 12 months. The energy and financial sectors led the charge in July – up 12.60% and 6.16% respectively. Another view of this rotation is through the lens of factors. The momentum factor was propelled by technology, AI and Hyperscalers and this factor took a sharp downturn in July. Conversely, the value factor (energy, financials, health care, etc.) took the leadership per the chart below. Corporate earnings continue to impress and are holding up the equity markets despite macro headwinds. According to Factset, as of July 31, 60% of S&P 500 companies reported, with 77% reporting positive revenue surprises and 86% reporting positive earnings surprises. So far, the year-over-year quarterly growth rate is over 40%.

The on again/off again situation with the Strait of Hormuz has obviously had an impact on energy and the interest rate steepening has aided financials. Staying in the U.S. the MidCap and Small Cap parts of the markets also retreated – S&P MidCap 400 and S&P Small Cap 600 returned -2.38% and -1.90% respectively (with both still up solidly for 2026). Developed international equities also retreated in July with the S&P Developed ex-US down 1.30% and S&P Emerging Markets down 3.16%. The emerging markets were affected by China, who reported Q2 2026 GDP growth at an annualized 4.3% - weakest since the 2020 COVID year. This was driven by weak domestic consumption.
The fixed income market experienced significant volatility after the Federal Reserve meeting and ended the month with a much higher yield. The 10-year treasury yield was as low as 3.97% at the start of March and touched 4.71% in July.

The increase in yield and resulting decrease in bond price hit the longer-dated maturities even more. The 20 year and greater ETF by iShares hit its lowest level in 22 years after the meeting.

The increase in yield and resulting decrease in bond price hit the longer-dated maturities even more. The 20 year and greater ETF by iShares hit its lowest level in 22 years after the meeting.
This increase in yields is part of what is helping the Fed get what it wants in higher rates without actual rate increases. This caused the S&P US Aggregate Bond index to close down almost 1.00% in July and brings it slightly negative for the year. This also drove mortgage rates to their highest levels in 2026 with the 30-year mortgage averaging 6.66% at the end of July. While one can debate whether interest rates remain where they are or, increase for the rest of 2026 is debatable but any interest rate decrease in the short-term looks unlikely.
The information contained herein should not be construed as personalized investment advice or a solicitation to buy or sell any security. Investing in the stock market involves risk of loss, including loss of principal invested and may not be suitable for all investors. Past performance is no guarantee of future results. This material contains certain forward-looking statements which indicate future possibilities. Actual results may vary. All expressions of opinion reflect the judgement of the authors as of the date of publications and are subject to change without prior notice. Additionally, this material contains information derived from third party sources. Although we believe these sources to be reliable, we make no presentation as to the accuracy of any information prepared by an unaffiliated third party.
June 30, 2026 - Chips and Dip
June 30, 2026- Chips and Dip
Written by: Steve Gattuso, Assistant Professor at Canisius University and Co-Chief Investment Officer of Courier Capital
Latest Developments and Economics
June did not lack for activity on many different fronts. First, the tenuous memorandum of understanding (MOU) between the U.S. and Iran had the immediate effect of achieving a cease fire between the two countries and opening the Strait of Hormuz without restriction for 60 days (or so we thought). There have been occasional skirmishes and retaliatory strikes a few times which seem to threaten the cease fire. Iran is tying the MOU with the Israeli conflict in Lebanon as a pretense for initiating isolated attacks in the Strait. The MOU, which has been set for 60 days, has been criticized in the U.S. for favoring Tehran. There are several economic benefits. Sanctions will be lifted so Iran can sell their oil in the open market again. Language refers to support for a reconstruction fund for Iran. Iran tentatively agrees to halt development of a nuclear weapon, but the MOU does not address the removal of enriched uranium, Iranian ballistic missile and drone program or support of terrorist proxies in the region. The MOU is generally vague as the details are meant to be negotiated during the 60-day period (which could be extended). There also seems to be some confusion about who is in authority to speak for Iran with contradictory statements between the government and the Revolutionary Guard (IRGC). For example, the IRGC states they will keep control of the Strait with tolls/fees in the future (which Oman has also repeated) while the government has been more diplomatic to repair the economy. A Singapore-flagged commercial vessel attack by a drone indicates that transiting the Strait is still risky. This means that high insurance rates for ships passing through and willingness of operators to chance it may limit the return of full traffic.
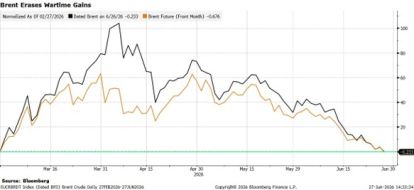
This didn’t stop the spot price of oil from dipping very quickly once the MOU was signed. Brent crude peaked at $138/bbl. on April 7 and dropped to almost pre-conflict levels of around $71/bbl. by the end of June. This drop was also reflected in futures markets implying that the oil market is back to normal immediately – which may be a bit optimistic on several fronts. For example, the demand impact on replacing the 400 million barrels of oil drawn from strategic reserves(SPR) globally. The U.S. SPR is down 75 million barrels since February and leaves the total at 340 million barrels – lowest levels since 1983. In response to the conflict several countries announced plans to start or expand their reserve program (China, India, Philippines, Mongolia and Australia are a few).
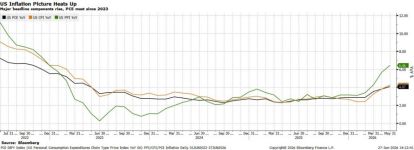
The increase in oil pricing was a major factor in the most recent inflation readings, which showed increases in headline inflation across the board. Headline CPI and PCE measures of inflation were up 4.2% and 4.1% on an annual basis respectively, which was widely expected. However, removing the effects of food and energy, Core CPI and Core PCE were up 2.9% and 3.4% on an annual basis, which is a movement away from the Fed’s stated goal of 2.0%. For CPI this was driven by services, including shelter, transportation and medical. The Producer Price Index (PPI) rose by 6.5% on an annual basis, driven primarily by final goods – the highest annual level since November 2022.
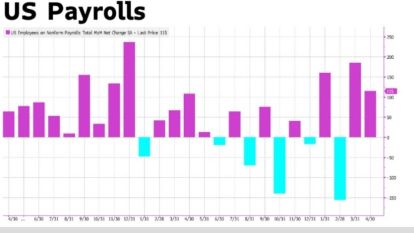
The news on the labor front was much stronger than expected. The economy generated 172,000 jobs in May, led by leisure and hospitality and health care, while the prior two months were also revised upwards. The stabilizing labor market was also reaffirmed by the job openings (JOLTS) firming and a steady unemployment rate of 4.3%. The one main concern is lagging wage growth.
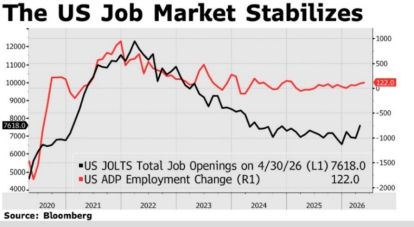
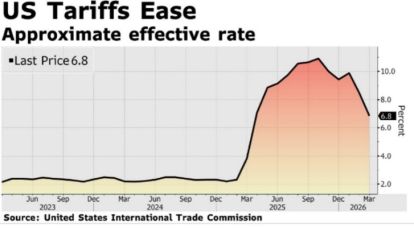
Turning to other notable economic news, the final read of 2026 Q1 GDP was revised up to 2.1% annualized rate from the prior estimate of 1.6% and much higher than the 2025 Q4 of 0.5%. Consumer spending was revised down in this third estimate and net exports were less of drag due to lower imports. Much of this reading was due to business spending – which was up 7.9%. This is driven by the large capital expenditures by companies pursuing artificial intelligence (AI) and intellectual property spend. The projected $650 billion of 2026 spending on AI amounts to almost 2% of GDP – the most investment as a percent of GDP on a single theme since the Louisiana Purchase. The amount of spending announced for AI will impact GDP for the next several quarters if it comes to fruition as announced. One last topic impacting GDP is tariffs (which have faded into the background). While they are still higher than recent history they are easing a bit from their peak in 2025.
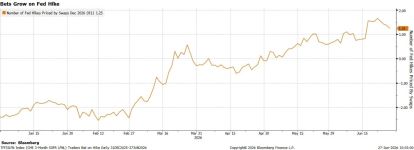
It is against this backdrop that Kevin Warsh conducted his first FOMC meeting and press conference as chairman. While he made no change to interest rates, as anticipated, he was very clear that inflation has been above target far too long and that his focus will be on price stability. Chairman Warsh was more hawkish than what was estimated, and he signaled that his Federal Reserve will be different in communication and forward guidance than previous administrations. He said that he prefers a “more thinking, less talking” approach. His words significantly changed market expectations for interest rate direction as a rate hike by September is now priced into many estimates. The reality will be determined as we receive more inflation data throughout the summer. The rapid reduction in oil prices will certainly be helpful in reducing inflation. However, AI may be a new source of near-term inflation. The supply chain issue of chips has caused final goods companies to announce price increases. Apple announced a $200 increase in the price of iPads (with iPhones possibly on the horizon) and Microsoft increased the price of Xbox by $100 all due to chip and memory costs. Global inflation has already caused international central banks to act. The European Central Bank (ECB) just raised rates by 0.25% to 2.25% and Japan raised rates by .25% to 1.00% - the highest level there since 1995.
Financial Markets
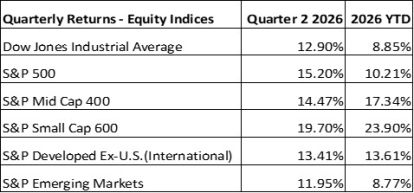
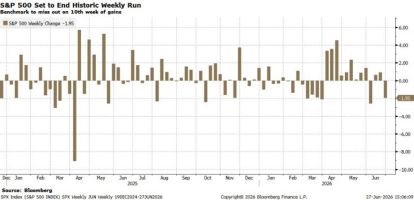
The equity markets staged quite a comeback during April and May and then took a pause in June. As one can see above this quarter generated all the gains so far for the year. At one point the S&P 500 was up 9 consecutive weeks – just one short of the longest streak set in 1985.
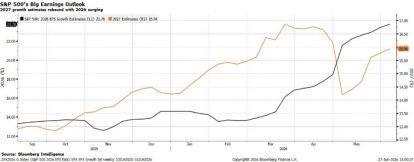
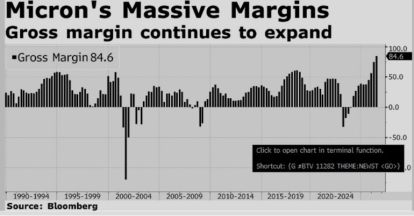
The S&P 500 recovery has been driven by reduced geopolitical tensions with the MOU and cease fire with Iran as well as continued strength in company earnings. The Information Technology (IT) and Industrials sectors led the index increase and both were related to the AI theme and datacenters. Even within IT the dispersion of industry returns is dramatic. Semiconductors and Computer Hardware have nearly doubled this year while Software and Software Services are down. Most other sectors had single digit returns for the quarter while Energy was down 13.45% due to the opening of the Strait of Hormuz. In addition to companies continuing to exceed expectations in the second quarter, the earnings estimates for the calendar year continues to rise as well. The S&P revenue growth is now expected to reach 24% for the calendar year, though it is still concentrated in the AI themes of semiconductors, hardware, power, construction and refrigeration. One example of a company benefiting from the chip shortage is Micron. Micron has continued to raise prices on memory chips and has resulted in a recent reported gross margin of almost 85% - the greatest of any company in the S&P 500. The AI theme bears careful monitoring as the assumption of optimistic buildout and adoption drives the market price of these companies. This has the potential for volatility as we saw in the first quarter. In fact, the technology weakness in that quarter plus the rotation into other parts of the market has resulted in the S&P 500 Equal Weight outperforming the cap-weighted S&P 500 this year so far, and by a historically large margin (12.13% vs 10.21%). This almost looks like a barbell return pattern in the S&P 500 so far – AI Theme plus real economy stocks.
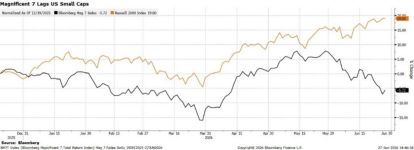
At this point U.S. Large Cap isn’t even the top performing asset class. It is U.S. Small Cap that, so far, has claimed that title – even beating the Mag 7. This has happened in the recent past with returns dipping quickly and a higher interest rate environment has traditionally posed headwinds to small companies. However, U.S. Midcap and Developed International stocks have also beaten the S&P 500 so far this year.
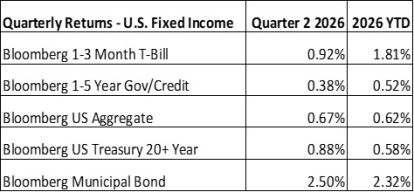
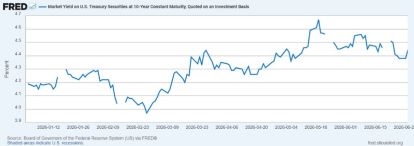
Finally, fixed income has not had much to write home about this year so far as the interest rate expectations have whipsawed the asset class. Most investment grade fixed income is flat on the year with the exception of municipal bonds, which have posted gains. The yield on the 10-Year Treasury has bounced in 2026 from a low of 3.97% in February to 4.67% in May.
The information contained herein should not be construed as personalized investment advice or a solicitation to buy or sell any security. Investing in the stock market involves risk of loss, including loss of principal invested and may not be suitable for all investors. Past performance is no guarantee of future results. This material contains certain forward-looking statements which indicate future possibilities. Actual results may vary. All expressions of opinion reflect the judgement of the authors as of the date of publications and are subject to change without prior notice. Additionally, this material contains information derived from third party sources. Although we believe these sources to be reliable, we make no presentation as to the accuracy of any information prepared by an unaffiliated third party.
May 31, 2026 - Strait and Narrow
May 31, 2026- Strait and Narrow
Written by: Steve Gattuso, Professor at Canisius University and Co-Chief Investment Officer of Courier Capital
Latest Developments and Economics
The conflict that started at the end of February and was supposed to last only a few weeks continues with no clear end yet in sight after three months. While the financial markets have seemed to move past this, the economic impacts are currently showing up in the data.
The main effect is the opening of the Strait of Hormuz. Brent Crude spot prices were hovering around $60/bbl. before the conflict and have peaked at over $118 more than once during the last three months. Currently, the spot price is just over $90/bbl. as the news of potential agreements and subsequent attacks have whipsawed the price over that same time period. A similar pattern has occurred with WTI Oil prices but not as high due to WTI oil being more domestic in production. The U.S. feels the oil shock less than other countries given a greater degree of self-sufficiency. In fact, the U.S. has been exporting about 14 million barrels per day – an historically large volume.
This doesn’t mean that there has been no impact in the U.S. Gasoline prices are the most obvious to the consumer with prices rising to well over $4 per gallon as a national average. Mark Zandi from Moody’s estimates that each U.S. household has spent $450 extra on gasoline since the war started which is about $59 billion in total.
So far, even with the increase in price, the full impact of less oil flowing has not been felt. There were about 400 million barrels released from strategic reserves globally but, the buffer of this release and the ships that were already on route when the conflict began, are starting to wind down. The demand destruction has also helped stretch this out. This means that oil deficits could soon become oil shortages. While there has been a small increase in ship traffic through the strait, it is nothing close to usual. In addition, even if the strait is opened today, the incremental improvement would take between 30-60 days to begin recovery and, according to Fatih Birol, executive director of the International Energy Agency, it could take up to two years to fully restore the production that was damaged.
In sum, oil is not likely to return to pre-war price levels anytime soon. This says nothing about the global impact of other items affected by the strait’s continued closure which include fertilizer, natural gas and aluminum.
The first evidence of the increase in oil prices was through inflation, which was to be expected. The April headline Consumer Price Index (CPI) was up 0.6% month-over-month and 3.8% year-over-year. This follows a March annual that was up 3.3% and is the highest annual rate since May 2023. Even stripping out energy and food, the Core CPI was up 0.4% month-over-month and 2.8% on an annual basis. The Core CPI was driven by shelter and services costs as well as continued incremental impact from tariffs.
It wasn’t just CPI – the Producer Price Index (PPI) showed similar behavior. The April headline PPI rose by 1.4% month-to-month and 6.0% on an annual basis – highest level since December 2022. This was also up significantly from an annual 4.3% in March as energy prices alone were up 7.8%. Core PPI was up 1.0% on a monthly basis and 5.2% on an annual basis. There is evidence of the energy situation affecting other goods and services (i.e.: transportation costs through airlines and food). Moreover, the AI buildout is affecting prices in the short run as electronics were up 27% annually due to the shortage of memory chips.
This puts the new Federal Reserve Chairman Kevin Warsh in a tough spot. Warsh was narrowly confirmed as Fed Chair to replace Jerome Powell in May by a 54-45 vote – the slimmest margin since 1977. June 16th will be his first meeting, and he is walking in to a divided committee. At the last meeting the FOMC held rates constant, but the statement met with four dissents – the most since 1992. Three of the dissenters preferred language taking out the bias (or signaling) that the next rate move would be lower while Stephen Miran dissented in preference for a rate reduction.
The situation is drawing attention to the inflation side of their mandate. With a recent new jobs report of 115,000 and unemployment steady at 4.3% the labor situation seems stable. Inflation creeping up and becoming ingrained is the wider issue. Inflation has become such a concern that markets are pricing in an almost 30% chance of an interest rate INCREASE by the September 2026 meeting.
These factors are starting to make the economic environment more challenging for the consumer. The 2026 Q1 GDP was revised down from 2.0% annual rate to 1.6% driven by lower inventory investment and consumer spending. The expenditures on gasoline have cannibalized discretionary spending that would be used on other goods and services. Moreover, the consumer is once again losing ground on purchasing power as wage growth has slipped below the inflation rate. This means that some consumers are dipping into savings as the aggregate savings rate of income dropping to 2.6% in April versus a 30-year average of 5.7%.
This is putting consumers in a melancholy mood. While they keep spending (especially the higher earners), consumer sentiment dropped to a record all-time low of 44.8 in May and is the third consecutive monthly decline. The key drivers affecting consumer’s mood are gasoline prices, higher cost of living (homes, cars, food, etc.) and anxiety about inflation expectations in the near-term.
Financial Markets
Despite the continued conflict with Iran, U.S. Large Cap stocks set 11 new record highs driven by a strong earnings season. The returns, however, continue to be narrowly concentrated in the AI theme and centered around Information Technology, Energy and Communication Services. The S&P 500 returned 5.26% in the month of May and the IT sector return was 5.60% (which means the other sectors were a combined net flat). The index was down 4.3% for 2026 through March and is now up over 11%, with the turnaround happening in April and May.
The Q1 earnings results and the increased estimated earnings growth of up to 24% for 2026 are centered around the AI theme and four companies, specifically, are responsible for almost half the estimated increase (Nvidia, Micron, Google and Meta). The US economy and earnings growth are in large part due to the estimated $700 billion that the hyperscalers are spending to implement AI and corresponding data centers. This creates a need for the picks and shovels of chips, memory and energy. US MidCap and Small Cap, as well as international equities, were positive for the month, but not nearly as much as the S&P 500.
Almost all fixed income sectors were flat for the month but the volatility during the month was significant. Generally, yields moved with headlines – the back and forth of the Iran conflict, and subsequent oil prices, implies higher near-term inflation and no interest rate cuts. The yield on the 10-year U.S. treasury bounced from 4.36% to 4.67% before settling down to 4.45% by month end.
Geopolitical tension resolution and the opening of the Strait of Hormuz would go far in settling the economic environment in the near-term (maybe just in time for mid-term elections).
Disclaimer: The information contained herein should not be construed as personalized investment advice or a solicitation to buy or sell any security. Investing in the stock market involves risk of loss, including loss of principal invested and may not be suitable for all investors. Past performance is no guarantee of future results. This material contains certain forward-looking statements which indicate future possibilities. Actual results may vary. All expressions of opinion reflect the judgement of the authors as of the date of publications and are subject to change without prior notice. Additionally, this material contains information derived from third party sources. Although we believe these sources to be reliable, we make no presentation as to the accuracy of any information prepared by an unaffiliated third party.
March 31, 2026 - Single Subject Shock
Latest Developments and Economics
A couple months ago this letter mentioned the unpredictability present in the recent environment. The war against Iran that began at the end of February fits that description. The energy shock is the single subject dominating the news flow. The administration came out and said that this war would last only a few weeks. Here at the end of March it continues with no de-escalation in sight. The U.S/Israeli initial goal was to eliminate the Iranians ability to develop a nuclear weapon and to threaten their neighbors. Along the way there was also mention for regime change, a much more ambitious endeavor. As for the Iranian government, their goal is to survive – which they can do by waiting this out. They have been successful in cutting off a major chokepoint in the Strait of Hormuz, a channel where 20% of the world’s daily oil flows. Yemen’s Houthi rebels are now starting to threaten another oil chokepoint in the Red Sea. The impact on oil prices is global as Saudi Arabia, UAE, Qatar and Iraq flow through Hormuz and many have had to shut production.
The strait closure has a greater impact abroad as the U.S. is more energy independent than in the past and certainly more than Europe, Asia and Africa. The beneficiary of this conflict so far is Russia. Not only has the U.S. taken their eye off Ukraine but, Russia is selling more unsanctioned oil at inflated prices. The rise in oil prices has been quick and steep. Brent is showing more price sensitivity than U.S.-based WTI. The release of 400 million barrels globally from the strategic oil reserve replaces about 20 days of lost production. Should this continue, oil prices could rise further and some countries around the world could experience physical shortages of the commodity.
The longer the conflict continues unresolved the greater the impact on oil prices. There are two takeaways from the adjacent chart. First, oil prices increase as this goes through spring unresolved with Brent price potentially reaching $150/bbl if it goes through mid-June. Second, oil prices are expected to take time to normalize as production and supply chains come back online. Projections are that oil will not approach pre-conflict prices until end of the year and may not get back to $60 soon.
One last item is that strait closure affects more than just oil. It also affects derivative products of oil as well as natural gas and fertilizer. About 20% of global natural gas, from Qatar, flows through the strait with no replacement possible as liquified natural gas must travel via sea, unlike oil which can travel across land pipelines. The strait also carries about 33% of global fertilizer trade through nitrate and phosphorus-based products. The timing of spring planting season in some parts of the world could have significant impact on crop yields and food supplies.
All of this is having an impact on near-term inflation. The energy shock will cascade through products that require transportation and put upward pricing pressure on those products (i.e.: food). In addition, the tariffs are still having a general impact as well. Despite this shock in the near term, intermediate term inflation expectations still reflect moderation towards the Fed’s 2% target.
This puts the Federal Reserve in a tough spot. They are dealing with an increase of inflation through the energy prices and a slowing labor market. New job creation has slowed markedly and has held up only with significant support from health care sector hiring.
Federal Reserve participants now see potential risks to both inflation and full employment in the short term. This means that further interest rate cuts look likely to be pushed off until the conflict settles. Some forecasts have incorporated a potential rate increase due to inflation, however there is a very high bar before a rate hike is part of Federal Reserve conversations. In a recent speech at Harvard Chairman Powell felt rates were “in a good place” and that rate hikes in the face of supply shocks have little effect. Usually, the shock is passed by the time rate changes would have an impact. While initially a source of inflation, if the shock were to go on longer, then the possibility of an economic slowdown increases.
At this point the conflict can either move towards resolution or escalation. President Trump continues to talk about negotiations while also threatening escalation with targets of power, water and infrastructure if the waterway isn’t opened by April 6. Moreover, recent polls by Pew research show that 61% disapprove while 37% approve of the administration’s handling of the war. In addition to popular feelings, political pressure in the form of upcoming mid-term elections may also have an impact on reaching a settlement to this conflict sooner rather than later.
Even with this uncertainty the jobs market remains stable, the consumer remains resilient and there has been no negative impact on earnings expectations of U.S. companies, so the economy is holding up well in the face of many headwinds.
Financial Markets
This was not a good quarter for many asset classes. Global stocks, bonds, private assets and even gold all had their troubles during the first quarter. Entering 2026 the markets had quite a bit to digest – high stock valuation, concerns about AI in terms of both capital expenditures and replacement of certain industries, and some trouble spots in private credit all were present before the conflict with Iran at the end of February. That became THE issue during the month of March, and financial markets responded sharply.
At the index level the S&P 500 looked rather calm entering March, however turbulence lay below the surface. The ensuing conflict had a more significant impact on the entire market this month. The S&P 500 lost 4.33% for the quarter with all of it coming in March. This represented the worst quarterly performance since the third quarter of 2022. The index was down as much as 7% during the month but a relief rally on the last day of March softened the blow. All sectors, except energy, were down during the month of March. The decline left the S&P 500 below its 200-day moving average.
Growth stocks led the way down in the quarter with that factor down over 8%. It was Financials, Consumer Discretionary and Information Technology that ended the month almost in correction territory with all three sectors down over 9% for the quarter. There was a rotation out of technology into the more value-orientated and defensive parts of the index. As a result, Communication and Health Care joined the previously mentioned sectors with a loss during the quarter. The rotation kept Real Estate, Industrials Staples, Utilities and Materials positive for the quarter but, none came close to energy. The Energy sector recorded a quarterly return of over 38% for Q1 of 2026 (and not all of it was in March). The Mag 7, which has led the market the last few years, could be renamed the ‘’Drag 7’ so far in 2026 as they collectively entered correction territory (down more than 10% from highs). This drawdown was led by Microsoft and Meta (Facebook) both down over 30%.
Quarterly Returns - Equity Indices
| Index | Quarter 1 2026 | Last 12 Months |
|---|---|---|
| Dow Jones Industrial Average | -3.58% | 10.33% |
| S&P 500 | -4.33% | 17.80% |
| S&P Mid Cap 400 | 2.50% | 17.35% |
| S&P Small Cap 600 | 3.51% | 20.50% |
| S&P Developed Ex-U.S.(International) | -0.05% | 27.75% |
| S&P Emerging Markets | -2.57% | 20.10% |
Quarterly Returns - U.S. Fixed Income
| Index | Quarter 1 2026 | Last 12 Months |
|---|---|---|
| Bloomberg 1-3 Month T-Bill | 0.88% | 4.12% |
| Bloomberg 1-5 Year Gov/Credit | 0.14% | 4.15% |
| Bloomberg US Aggregate | -0.05% | 4.35% |
| Bloomberg US Treasury 20+ Year | -0.30% | -0.31% |
| Bloomberg Municipal Bond | -0.18% | 4.29% |
The rotation out of technology also extended down market capitalization and, even with a rough March, both S&P MidCap 400 and S&P SmallCap 600 ended the quarter in positive territory. Given the energy vulnerability relative to the U.S., the conflict was especially hard on Developed and Emerging International stocks by erasing their 2026 gains. The S&P Developed Ex-U.S. is now flat for 2026 and the S&P Emerging is down 2.57%.
Fixed Income did not really provide much cover either during the quarter. Most sectors that were not cash were either flat or slightly down. The realization that interest rate cuts may not be forthcoming due to the inflationary effects of the conflict on energy prices sent bond prices down. As Powell referenced in his recent speech, the Fed is a position to wait and see what happens on the geopolitical and resulting economic front to make any moves. The market is now pricing in only one cut later this year. Credit spreads also were negatively affected due to this policy change as well as energy prices and the uncertainty of geopolitics.
The higher for longer interest rates, plus a flight to quality, have temporarily strengthened the dollar. This also had the impact of sending gold down. Staying on commodities, oil took up the precious metals slack with Brent oil futures rising a historic 55% for the month. Once the conflict is resolved the direction of the dollar will be something to watch – does it resume the recent decline, or does it retain the strength it found during the conflict?
Another sign of anxious financial markets is the level of volatility index (VIX). The implied volatility rises in times of stress in the markets. The markets so-called fear gage’ has risen to 30 indicating heightened volatility. The market VIX was only this high twice in the last 5 years – the day tariffs were announced last April and the Japanese carry unwind in August of 2024.
Finally, private markets have been getting attention due to defaults. While there have been some high-profile events regarding the asset class these seem to be limited to very specific, more aggressive parts of that market. While there have been corrections and some normal liquidity gating, there are no signs of a widespread issues. Even Chairman Powell commented that "We're looking for connections to the banking system, and things that might, you know, result in contagion. We don't see those right now." So, while some investors are experiencing undesirable results that are a normal part of financial market investing, there are no signs of systemic threats to financial markets according to Powell.
Disclaimer: This information contained herein should not be construed as personalized investment advice or a solicitation to buy or sell any security. Investing in the stock market involved risk of loss, including loss of principal invested and may not be suitable for all investors. Past performance is no guarantee of future results. This material contains certain forwardlooking statements which indicate future possibilities. Actual results may vary. All expressions of opinion reflect the judgement of the authors as of the date of publication and are subject to change without prior notice. Additionally, this material contains information derived from third party sources. Although we believe these sources to be reliable, we make no presentation as to the accuracy of any information prepared by an unaffiliated third party.
February 28, 2026 - President's Month
Latest Developments and Economics
February is the month that the President’s Day holiday is celebrated in recognition of the birthdays of both President Washington and President Lincoln. This February could also be labeled President’s month as well given the numerous topics that involved President Trump’s administration. One of the first issues in February was a second government shutdown in three months, albeit a partial shutdown. The current Federal shutdown started on February 14, when funding lapsed for the Department of Homeland Security, which oversees ICE, Border Patrol, the Coast Guard, TSA and FEMA (even though ICE and Border Patrol are funded through 2029). This shutdown is over the subject of ICE reforms. The shutdown is still in place as of 2/28 with TSA employees a group receiving their last paycheck (which was partial) until settled.
In the first of unwelcome news for the administration on tariffs during the month the House voted 219-211 to revoke the tariffs that President Trump had imposed on Canada. This was done with 6 Republican representatives voting with Democrats on the motion. The President still retains veto power but the vote sent a political message about the declared emergency and subsequent tariffs. The most significant news about tariffs, which was generally expected, came from the Supreme Court which ruled 6-3 that the tariffs under the IEEPA were not within the scope of his authority.
Polymarket see ~25% chance of tariffs upheld
Essentially the court ruled that the IEEPA gave the President the authority to regulate trade against individual countries in an emergency but not to impose tariffs – whose power lies with Congress. If the act gave such powers to the President it would have been enumerated in the act and it was not. This sets many wheels in motion and throws the tariff situation into uncertainty. First, even though the court was silent on the subject, this means that up to $175 billion of the total approximate $293 billion in collected tariff revenues would need to be refunded. FedEx was the first of at least 1,800 companies who have filed lawsuits against the Federal government to obtain their portion of refunds.
The President immediately criticized the ruling and then imposed 10% across the board tariffs on all countries, which was increased to 15% the next day under Section 122 of the Trade Act of 1974. This act allows universal tariffs of up to 15% against countries that the U.S. has large and serious balance of payment deficits for up to 150 days. This act is meant for temporary remedies and can only be extended under other trade authorities. The most often cited would be section 232 or section 301 of the same act. However, under these sections, permanent tariffs can only be enacted after country specific investigations of national security threats or unfair trading practices have been concluded (which would normally take longer than 150 days). The President also has the option to go to Congress for new tariff laws to be enacted but, is of the opinion that he does not need Congressional approval to achieve what he desires. The ruling and subsequent section 122 15% meant immediate change in current tariff rates for many countries. Brazil, China and India, for example, had their proposed tariff rate reduced significantly while U.K tariffs increased. The global response to this decision was uncertainty as many of the countries that have reached trade deals with the U.S. before this ruling are not sure about the validity of those agreements. The European Commission in a statement released “As the United States’ largest trading partner, the EU expects the U.S. to honor the commitments set out in the joint statement — just as the EU stands by its own.” The Commission requested “full clarity,” stressing that the current situation is “not conducive to delivering fair, balanced and mutually beneficial transatlantic trade and investment.” Without tariffs passed into law by Congress the concern by trading partners is that the tariffs can be changed by future administrations.
Finally, the news about who bears tariff costs also did not align with the administration’s message. A New York Federal Reserve report suggests that importing companies and their consumers pay about 88% of the tariff costs while Goldman Sachs estimates that consumers pay about 55% of tariffs. Finally, up to this point the tariffs that have been imposed have done little to change the trade deficit, which was an administration priority when setting them. The most recent trade deficit in goods and services was $901.5 billion, virtually unchanged from 2024 at $903.5 billion.
A couple other activities for the month include the State of the Union address – one of the longest in history and the attack on Tehran by the United States and Israel. This last event occurred on February 28 so, other than the impact on oil prices, further developments will be forthcoming. The President did address the nation to highlight that the reason for the attack was to ensure that Iran never obtain a nuclear weapon and encouraged a change in leadership within the country.
The political and geopolitical events overshadowed much of the economic news of the month – one of the most significant being the latest data on the labor market. The shutdown-related delay in the nonfarm jobs held a surprise of 130,000 jobs added in January when only 60,000 was expected. This was enough to lower the unemployment rate to 4.3%. Many of these positions were in the health care and social services industries. Construction added 33,000 jobs while government lost 34,000 jobs net. Employee wages were decelerating but, at 3.7% annual rate, are still outpacing inflation. Furthermore, the annual revision for 2024-25 took officially reported job numbers down by 898,000. This, together with the decline in job openings supports the continued story of a stable but weakening job market.
Inflation was the other economic data that was eagerly anticipated. Here we continue to see some divergence in the data. The headline consumer price index continues to show progress towards target as the annual core CPI came in at 2.5%. This was accomplished through a continued moderation in shelter and a decline in used car prices. However, the other measures of inflation are turning up. Core PCE, the Fed’s preferred measure was up 3.3% and the core Producer Price Index (PPI) was up an unexpected 2.9%. Services was the main driver of the increase, up 0.8% on a monthly basis – highest since July.
The monthly surprises, with jobs up and inflation stuck, look to keep the Federal Reserve on the sidelines again for any interest rate changes at their March meeting. This will leave current Federal Reserve Chairman Powell with only the April meeting before his term ends. Kevin Warsh, if confirmed, will take over at the June meeting. He will take over during a challenging time with three primary goals. First, to do what he can to get inflation closer to the 2% target, reduce the Federal Reserve’s $6.5 trillion balance sheet without disrupting financial markets and maintain the independence of the Federal Reserve.
FINANCIAL MARKETS
February was a challenging month for U.S. Large Cap stocks with the S&P 500 down just about 0.8%. Concerns over investment in Artificial Intelligence and its impact on various industries caused declines in several industries. Recently the following industries have all exhibited double-digit stock prices declines due to concerns over replacement by AI: Front Office Software, Gaming, Legal Tech, Insurance Brokers Wealth Managers, Property Managers and Freight Logistics. One example of decline is the trucking industry below. One specific company example is the recent an-nouncement by payments company Block (headed by Jack Dorsey) who announced layoffs of up to 40% of staff due to AI. The magnitude of the layoffs have drawn skepticism that AI is being used as cover for employee reductions and other cost cutting measures. The future response to the AI threat by labor in affected industries will be a dimension of the revolution to watch.
The large sectors of Information Technology, Financials, Consumer Discretionary and Communication Services led the S&P 500 down in February. The small and somewhat neglected sectors of Utilities, Energy and Materials led the index with returns of 10.4%, 9.4% and 8.4% respectively. The rotation out of the leading sectors into the more val-ue-orientated hard asset sectors also extended into smaller sized companies in the U.S. The S&P MidCap 400 and S&P Small Cap 600 were up 4.1% and 2.2% respectively and both are beating the S&P 500 YTD. International equities continue global leadership over the U.S. counterparts with the S&P Developed ex-US up 5.7% and S&P Emerging up 2.7% in February. Even with the recent gains both smaller U.S. companies and international have a ways to go before their valuation reaches that of U.S. Large Cap equities.
Fixed income was the beneficiary of equity market volatility in February as investors sought the relative safety of treasuries. Despite significant funding requirements of the U.S. budget deficit and inflation that is struggling to decline, the yield on the 10-year treasury dropped to 3.95%. This was enough to cause 30-year mortgage rates to fall below 6.0% for the first time since September 2022. As a result, treasuries had their best month in a year, and the S&P U.S. Aggregate Bond index was up 1.3% for the month. The drop in yield could also be a result of growth fears and AI disruption. It may signal that the Federal Reserve may be led to reducing rates to provide economic stimulus in such an environment.
January 31, 2026 - Uncertain vs. Unpredictable
Latest Developments and Economics
The near future of the economy and financial markets are always uncertain – we cannot have 100% predictability about the future state. We deal with this every day and can intelligently forecast possible outcomes based on trends, data and economic direction that we ascertain and then act accordingly based on the probability of those events. However, occasionally we experience periods of regime change, limited visibility or unprecedented events that mean forecasts based on historical relationships are less predictable due to either black swan events (ie: COVID) or a changing order that has no previous pattern. Some issues recently fall into the latter category.
The first of these types of issues revolves around geopolitics and U.S. strategy. The most visible impact of this has been trade policy and tariffs. This topic continues to be very fluid since tariffs were first announced last April. Direction is constantly changing and the Supreme Court has yet to rule on the emergency powers foundation of some tariffs. In addition, new levies and deals are happening weekly. In January phased tariffs of 10% and 25% were announced on Europe until a satisfactory deal was struck regarding Greenland and then came off (before they started). A new agreement with India was also just announced. This creates not only a new order regarding globalization but represents a regime change as other countries try to strike deals with each other as a hedge against U.S. actions. This situation most likely will continue to develop for the foreseeable future.
The administration is also much more active on the world front. The removal of Maduro in Venezuela, the confrontation with Iran and the expressed goals of leadership change in Cuba are much more direct interventions than what has been done in recent prior administrations.
Another change requiring adjustment is the government as an investor in private companies. This started with expressed desires or prohibitions such as the purchase of U.S. Steel by Nippon Steel. There have also been specific industry-related goals such as a credit card rate interest rate cap of 10% for a year, disallowing corporate purchases of single family homes and prohibition of dividends and share buybacks for defense companies. It has become more direct through government funding in exchange for ownership of companies like Intel, Westinghouse, Lithium America Corporation and, most recently, MP Materials (a rare earths producer). The government as an investor adds another dimension to company analysis.
The prospect of a second government shutdown within three months means that the Federal Reserve and economists may also see a delay in the economic data they rely on to gage the direction of the U.S. economy as well.
Another change coming in May 2026 is the end of Chairman Powell’s leadership at the Federal Reserve to the Trump-appointed Kevin Warsh (assuming confirmation). Kevin Warsh has five years of relevant experience as a Fed Governor, especially during the Great Financial Crisis. However, there are conflicting signals on the general direction that the Fed will take under his term. Historically, Kevin Warsh had been considered a ‘hawk’ and was quick to move on inflation by raising rates. He also was critical of the Federal Reserve pursuing goals beyond its mandate and using the institution as cover for weak fiscal discipline. Finally, he was not in favor of a large Fed balance sheet. These stances seem incongruent to what President Trump was searching for in the next Chair. The President has repeatedly expressed his desire for much lower interest rates and a consultative role in the direction of interest rates. Kevin Warsh recently endorsed a lower interest rate stance even with weak economic foundation for more cuts. It must be noted that the Fed chair exerts significant influence but is still one vote of twelve. Furthermore, Jerome Powell may remain on the board as a Governor, which is rather unprecedented to have current and former chairs on at the same time. Even if the Federal Reserve resumes a rate cutting stance with Chairman Warsh it does not achieve the goal of lowering rates at the longer maturities and would result in a further steepening of the yield curve. Without longer end rates coming down mortgage rates do not come down either.
The prior reference to the environment for further rate cuts has to do with the continuing story of labor and inflation. Chairman Powell assessed the labor market as ‘stabilizing’. This stabilization comes from the new jobless claims averaging in the low 200,000 range and not moving up. Moreover, the ‘quits’ rate is back at pre-COVID levels and the jobs to unemployed ratio is back to 1.4 indicating a more normal labor market. Finally, the unemployment rate remains low at 4.4% and has held steady recently. This does not, however, indicate a turnaround in new hiring. That metric is still constrained – especially in the private sector.
A smaller pool of active job seekers is keeping the unemployment rate steady. The shrinking pool is due to retiring workers, lower immigration and lower birth rates. This data was enough support for the FOMC to not continue with further easing in January.
Further reinforcing no further easing on rates is the stalled progress on inflation. Annualized CPI in December was 2.7%, which is where it seems to have leveled recently. Moreover, the Producer Price Index (PPI) rose in December to 3.0% annually when 2.7% was expected. Core PPI rose to 3.3% annually in December. Finally, the economy is in a position where added stimulus does not seem necessary. The third reading of Q3 GDP came in at 4.4%, a 0.1% increase from the previous reading and Q3 follows a Q2 of 3.8% - both well above trend. GDP also continues to be driven by very active consumer spending. Holiday spending and the pull ahead of electric vehicles sales before tax credit expiration drove the consumer.
The recent weakness in the U.S. dollar has also caused greater demand for precious metals. The demand by retail investors as well as central banks globally has caused gold and silver to set new record highs. Interest rate declines in the U.S, perceived future Fed independence plus uncertain trade policy has caused the dollar to experience four-year lows. The Federal debt situation, together with budget deficits are also part of the issue. This has also caused significant volatility in those metals. Once Kevin Warsh was selected as potential next Federal Reserve Chairman fears seemed to settle initially and took the wind out of the precious metals trade. As a result gold fell and silver had the worst day since 1980 when the Hunt brothers tried to corner the silver market.
One final topic without precedent surrounds the near term development of Artificial Intelligence (AI). The amount of capital being invested by hyperscalers alone is well over $500 billion announced for 2026. This arms race is all about capacity as the power requirements, copper and chips required are massive and will strain current supply. The other question around it is the return on the investment of all of this capital and funding of the circular agreements being struck. In the past tech companies were ‘asset light’ but now they have become ‘asset heavy’ with all these dedicated funds.
FINANCIAL MARKETS
Geopolitical events, tech earnings and a sell-off in Japanese bonds caused volatility in U.S. equity markets in January. On January 20, the Greenland tariff threat was one of the primary reasons that the S&P 500 closed down 1.23%. The markets recovered after President Trump indicated that he would not use force to take Greenland and that a deal would be worked out with Europe. By the end of the month the S&P 500 closed up 1.45%, improving on a flat Decem-ber. The other notable development In January was the rotation out of big tech. The sector was among the worst performers during the month. Financials were down 2.41% and Information Technology coming in second down 1.66%. The leading sector was Energy – up 14.43% due to the developing conflict with Iran. Materials and Consumer Staples also performed well – up 8.71% and 7.71% respectively. Despite the recovery, the S&P 500 continues to lag returns in international equities. Once again, developed market equities beat the S&P 500 in January with a return of 6.15% in the S&P Developed Ex-U.S. index and adds to the lead over the last twelve months with more than double the return of the S&P 500. The S&P Emerging Markets index was up 5.50% in January, also significantly outperforming the S&P 500 over the last twelve months.
One bright note in the U.S. during January were the MidCap and Small Cap stocks. The rotation in the month wasn’t just out of tech and into cyclicals but out of large cap into smaller companies. The S&P Midcap 400 was up 4.05% and S&P Small Cap 600 was up 5.61% for the month. This is due to some of the elements of the One Big Beautiful Bill Act, interest rate expectations, and projected earnings growth. Despite the downdraft in precious metals, gold and silver, together with energy, as oil and natural gas contributed to commodities increasing in January with the Dow Jones Commodity Index was up 9.25% in the month.
In review of fixed income the past several months has generally seen the 10-year treasury yield trade in range of 4.10%-4.20% with a December average of 4.14%. In January that average rose to 4.26% and settled back to 4.20% after hitting a high of 4.29% on January 20. This rise in yield came from much of the same sources as the equity decline. Specifically, this was due to trade policy and tariff announcements that created further inflation fears. Moreover, the yield curve continues to steepen as the Federal Reserve lowers short term rates but, future uncertainty about federal debt and a potential politicized Fed, caused investors to demand more term premium from longer-dated treasuries. This resulted in January returns on fixed income to remain muted. The S&P U.S. Aggregate Bond index returned just 0.23% for the month. Similarly, iBoxx Treasuries and iBoxx Agency fixed income were up 0.06% and 0.09% respectively. Even iBoxx Investment Grade fixed income was up only 0.32%.
Each of the items above will continue to develop during 2026 and, more political issues will also come to the forefront as U.S. midterm elections will take place in November.